Simple Linear
Regression Using
Python
The very basics of Machine Learning starts with
understanding Simple Linear Regression and
implementing it in a programing language.
Python being already equipped with so many
statistical computing and analysis library makes
this task way easier.
Let's learn how can we use python to predict some
values using SLR . I am using Spyder as IDE.
We will be using a test set containing salaries and
years of experience. Like this:-
YearsExperience
|
Salary
|
1.1
|
39343
|
1.3
|
46205
|
1.5
|
37731
|
2
|
43525
|
2.2
|
39891
|
2.9
|
56642
|
3
|
60150
|
3.2
|
54445
|
3.2
|
64445
|
The dataset has 30 records and can be found in
the link
Once done. You need to import this dataset into
python for which you can use the class Pandas
Import it by writing
import pandas as pd
You now need to obtain the import the dataset.
dataset = pd.read_csv('Salary_Data.csv')
Ensure that the file is in the same directory you are
saving your code in. If not mention the path of the
file in read_csv() function.
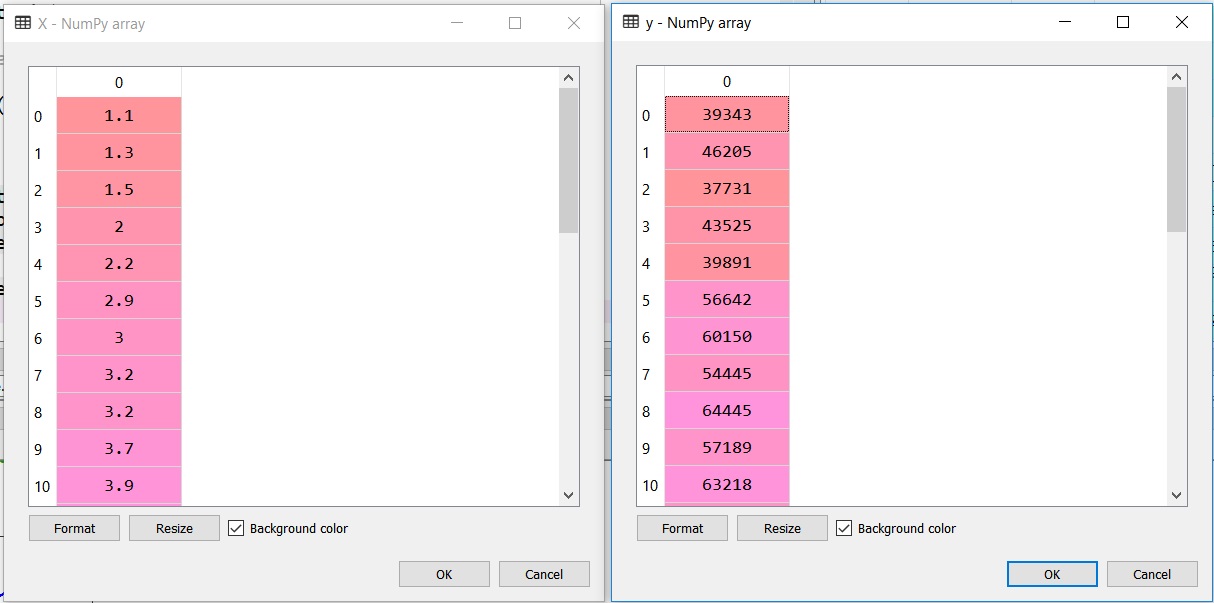
Now, you have the complete data imported in the
dataset variable and it will appear somewhat like

But, you want the values of X(Years of experience)
and Y(salary) in separate variable.. What to do???
Simple!!! Just slice it using iloc
X = dataset.iloc[:, 0].values
y = dataset.iloc[:, 1].values
Where the first parameter in iloc denotes the
number of records we are taking.
A ‘:’ colon means take all rows.
The second parameter indicates the column to take.
Since, we want to need the first column in variable X, 0 is used.
Once done you can see the values of X and Y
containing Years of experience and Salary respectively.
I hope it has been easy to understand the concepts
so far.
Now let’s dive a little deep and divide our data into
test set and training set.
Why do we need to have a training set?
It is because once you conclude a best fit line using
the training set you must have some data to check
how appropriate your estimation is.
Splitting data into test set and
training set.
In order to split the data into random test and training set,
a function train_test_split from the sklearn library is used.
It could be imported like this...
from sklearn.model_selection import train_test_split
It returns lists of X_training, X_test, y_training,y_test
in the following order.
X_train,X_test,y_train,y_test=train_test_split(X,y,test_size=1/3,random_state=0)
Lets understand the parameters of train_test_split()
- First parameter X indicates the list of all X values(Years of Experience).
- Second parameter y indicates the list of all y values(Salary).
- Thirds Parameter indicates the fraction in which the test and training data must be split. Here the set of 30 data will be split like X_test=(⅓)*30 and y_test=(⅓)*30
While, X_train and y_train will have the remaining part which is X_train=(⅔) *30 and y_test=(⅔)*30.
- Fourth parameter indicates the randomness of the training and test set obtained. If it is set high, then for each run it will pick a new set of training and test values giving a new prediction each time of the run.
You can check the rest and training data underneath.
Fine, as of now..
Now its time to visualize the data, For serving the purpose we need to import LinearRegression.
from sklearn.linear_model import LinearRegression
Once imported just create an object of it using
regressor=LinearRegression()
And the fit the Training values into it using fit function.
fitting is equal to training.
Then, after it is trained, the model can be used to make predictions, usually with a .predict() method call.
regressor.fit(X_train,y_train)
y_pred=regressor.predict(X_test)
This predicts the values of Y based on X_test values.

On the left the predicted values of salaries exists
while on the right the actual values Salary from test
data set exists. You can compare y_pred with y_test
you will find the that model has given a very close predictions for the X_test values.
Finally, we have come to the point where we will plot and see how the data looks like.
Visualizing data
We have a library matplotlib.pyplot which helps in visualizing the data we have.
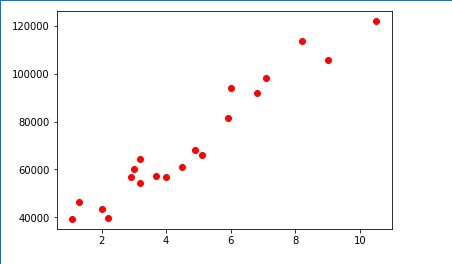
In order to plot the the Training point simply use the function scatter()
plt.scatter(X_train,y_train,color=’red’)
plt.show()
Will show the scattered points for the coordinates.
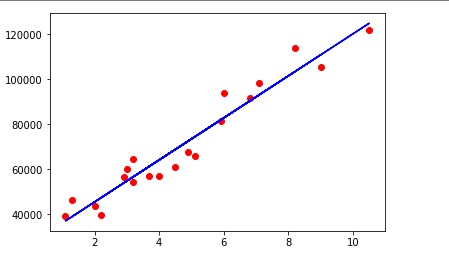
If you need to plot the best fit line you need to consider
the values of X_train along with the predicted values of
Y for X_train because prediction is just estimating the values of the salaries(Y) for the years of experience(X)
. I.e regressor.predict(X_train)
So the function will be kinda
plt.plot(X_train,regressor.predict(X_train),color=’blue’)
plt.show()

Now, if we see the line along with the scattered plots
we may find the varing Y value for a X_train value.
If you want to add title, label for X axis and Label for Y axis.
You can do it using.
plt.xlabel(“Years of Experience”)
plt.ylabel(“Salary”)
plt.title(“Salary VS Experience”)

Now, if we plot the same best fit line along with the
test values we can visualize how close is our prediction
with respect to the y_test values for a respective X_test.
Just replace plt.scatter(X_train,y_train,color='red')
in the above lines with plt.scatter(X_test,y_test,color='red')
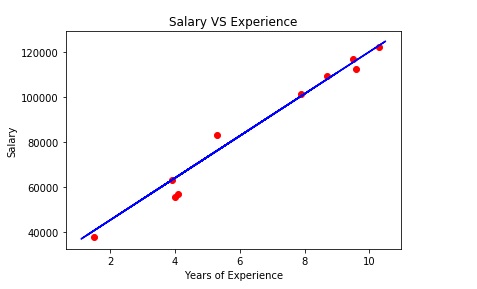
Just see how well the best fit line is!
The test datas are very close and some even falls on the best fit line.
So, this is how you can predict values using simple linear regression in python.
Now let’s try it out on my Experience.. ;p
I have 1.42 years of experience which is almost 1 Year 5 months.
So, what salary shall I expect in my current
organization now or what should I expect if I switch my company now.
y_p=regressor.predict(1.42)
The output I received is

Hope, you enjoyed reading the blog. For any doubt or query comment .
This topic on artificial intelligence is very much exciting, and the article is also so amazing. When we use deep learning as a service , it helps engineers to create a new and exciting product or technology in this field.
ReplyDeleteThanks Alfred😊
ReplyDelete